Tick-by-tick · order flow

Every tick.
Every level. Live.

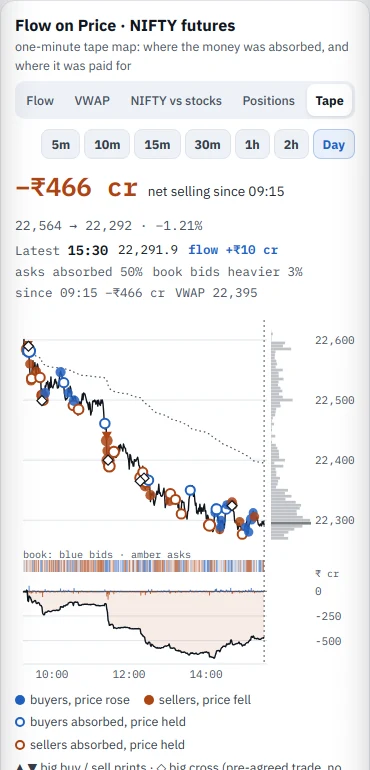
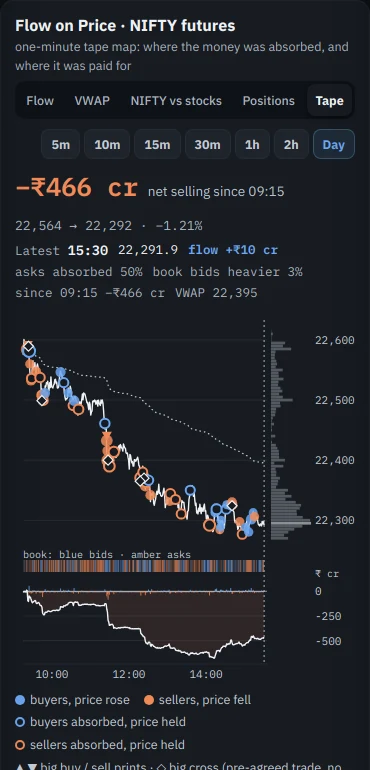
TBTflow watches buying and selling pressure build at every price, in real time — the same microstructure the desks see, made readable for Indian retail traders. Built on tick data, not tips.

NSE + BSE · NIFTY · SENSEX · F&O ◆ Colour-blind safe ▲ Data, not advice
Bid / Ask size RELIANCE · LIVE
2,951.0
1,240
2,950.5
2,090
2,950.0
1,580
LTP
2,948.20
▲ +0.58%
2,948.0
2,640
2,947.5
3,410
2,947.0
2,820
Blue = prints at / above VWAP · amber = below. Direction shown by glyph + colour — never colour alone.
Tick-by-tick
Live order flow
30sec
Panel refresh
09:15–15:40
IST market hours
L5
Book depth · every tick
Built on data, not tips. Analytics & education for Indian F&O.
How it works

From raw ticks to a readable setup.

1

We read the microstructure

TBTflow ingests the live tick stream — every trade, every depth update across the NSE F&O universe.

2

The engine lights up

The engine turns that stream into live reads — order-flow pressure, option walls, OI intelligence, market mood and more. See every panel ↓

3

You decide — it's data

TBTflow describes what the order flow is doing. The call is always yours. Analytics & education — never a buy/sell tip.

Inside TBTflow

What the engine actually does.

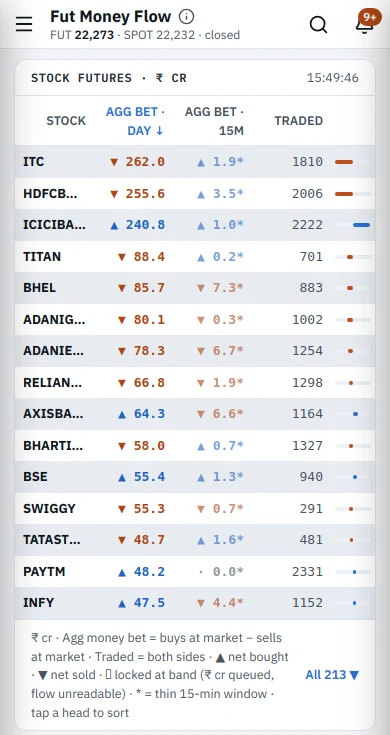
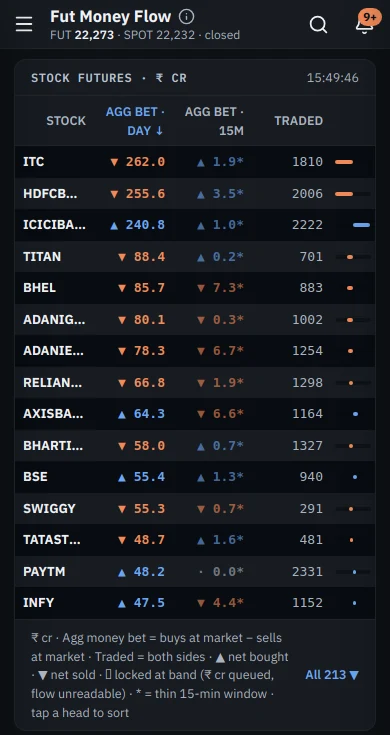
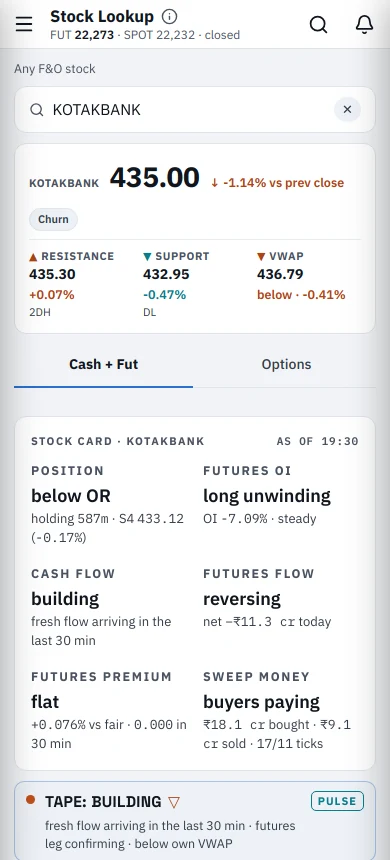
Two jobs, one tape: read the index like an institution, and watch all 208 F&O stocks at once. Everything below is descriptive market data — what the flow is doing, never what you should do.

The index — NIFTY & SENSEX

Every instrument, one clockCash · futures · options, together

The index is read the way it’s built: all its member stocks’ cash tape, the futures order book to tick-level depth, and the full options chain — captured side by side, so no single market can lie alone.

The tape, classified liveAggression vs absorption

Every futures tick is tagged as it lands — who paid, who absorbed, at five levels of book depth. Volume footprints show where the fight happened, not just how big it was.

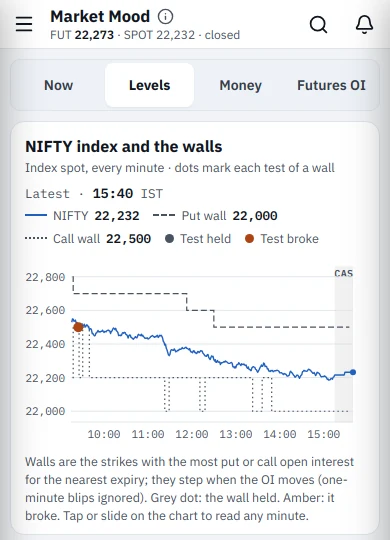
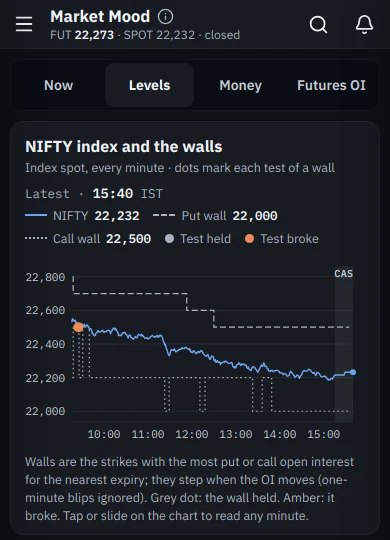
Market Mood: state and flow, kept apartDirection ≠ conviction

What the structure says and whether the money confirms it are scored separately — because averaging them is how every other tool hides a divergence. Agreement earns conviction; disagreement is the reading.

Options positioning & imbalancesWriters vs payers

Where premium is being defended with fresh money, where it’s being paid up for, and where the imbalance between the two stacks up — the walls, the pressure between them, and the smart-money footprint across strikes.

Gamma blasts & the CASClosing Auction Session · expiry has its own physics

Coiled premium that detonates on expiry afternoons — and the closing session where settlement is actually decided, minutes most charts never show. We record and read the CAS (Closing Auction Session), every single day.

Divergences → outcomes you can readPlain English, graded

When cash, futures and options stop agreeing, that disagreement becomes a chip on your screen: hollow rally, unpaid drop, narrowing participation. Every read is graded afterwards against what actually happened.

Over ₹1,00,000 crore of trades classified — every single day 1.7 crore order-book snapshots captured every week All 208 F&O stocks. Every minute. No exceptions. Two stocks crashed 1% in a minute. One was real. The data knew within minutes. Every reading is graded against what happened next The last minutes of price discovery happen after most charts stop. We record them. A candle is a summary. We keep the receipts it threw away. 3.4 million order-book snapshots captured every single session Same candle, opposite truths — the money behind it decides No tips. No targets. Receipts.
Every F&O stock — all 208, minute by minute

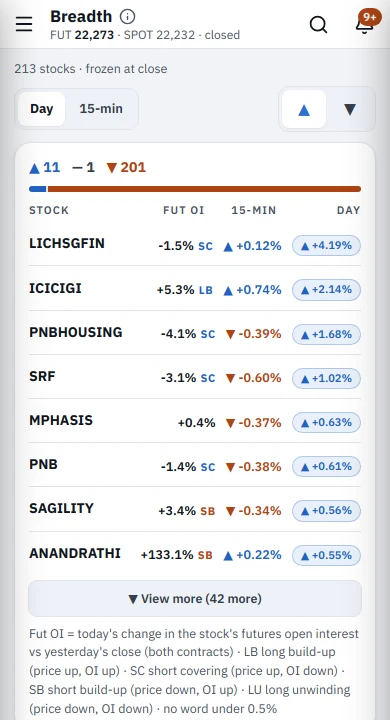
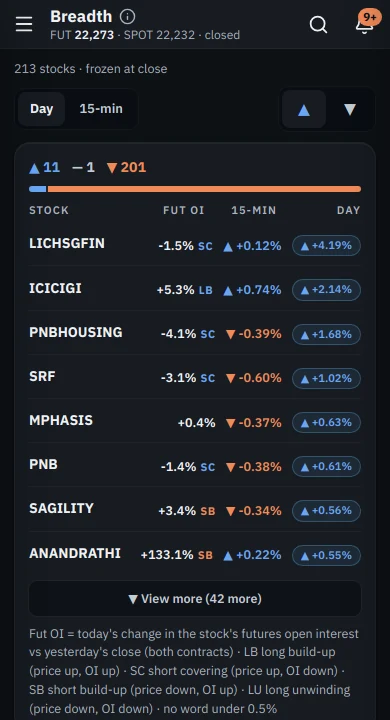
Movers & losers, four clocks1-min · 5-min · 15-min · full day

Gainers and losers ranked over 1-minute, 5-minute, 15-minute and full-day windows — built for the quick glance, with every read graded against what happened next.

Open interest, three clocksOvernight · session · live

OI change for every stock future on three horizons — overnight, since open, and the live rolling read — so you see positioning building or unwinding as it happens, not in tomorrow’s bhavcopy.

Basis & fair valuePremium / discount, decoded

Futures basis measured against fair value — premium or discount beyond cost-of-carry, the footprint of leveraged positioning. Rollover pressure tracked as expiry approaches.

Volumes in contextEQ · FUT · vs own baseline

Equity and futures volume judged against that stock’s own baseline for that minute of the day — dry, normal or high regime. A big number at 9:20 and the same number at 1:00 mean different things; the engine knows.

Quiet accumulation & distributionCommitment without headlines

Steady OI build with a consistent price path — names being accumulated or distributed with real positioning behind them, surfacing while they’re still quiet. The moves the movers-list never shows.

Levels, breaks & trapsBacked or bluffing

Day and prior-day highs and lows, key pivot bands — and when they break, whether volume and OI actually back the break. Level breaks with nothing behind them are flagged as the trap conditions they usually are.

Events that move marketsContext on every reading

Results days, expiry sessions, negotiated-deal windows, F&O list changes — the calendar context that changes what a number means, attached to every reading it touches. A burst on a results day is not the same animal as a burst on a quiet Tuesday.

Live panels do this work, and the roster keeps growing. All of it descriptive — demand-side vs supply-side pressure and positioning data. TBTflow never issues a recommendation.

Why TBTflow

The desks' edge, in retail's hands.

  • Microstructure, not lagging indicators. You watch pressure build at the level — before the candle closes.
  • Maths-first, colour-blind safe. Blue / amber only, with glyphs and solid-vs-dashed — readable for every kind of vision.
  • Data, not advice. TBTflow shows what the flow is doing. It never tells you to buy or sell.
The colour language
Bids▲ buy pressure
Asks▼ sell pressure
Last trade◆ the tick
Spread— no man's land
Pricing

One plan. Everything the engine sees.

Founding pricing, announced upfront. Every plan begins with a 7-day free trial — a full trading week, both weekly expiries included, before a single rupee is charged.

Founding members
Pro
₹1,499 ₹899 / month · incl. GST
List ₹1,499 — founding members save 40%
The full live cockpit — everything the engine sees, as it happens.
  • Real-time order flow & tape
  • Live MarketMood pressure read
  • Gamma terrain — walls, craters & vacuum zones
  • VWAP, sigma bands & RVOL context
  • Reversal radar & book-evacuation events
  • Founding-member price, locked for life
Start 7-day free trial — founding access

Trials are open. Free for 7 days — your bank shows a one-time ₹5 mandate authorisation (auto-refunded by Razorpay); nothing else is charged until day 8, a reminder before billing, cancel any time in two taps.

Founding cohort Founding members lock this price for life (while the subscription stays continuously active). Seats are limited; a cancelled seat returns to the pool. When the cohort fills, it closes for good — list price applies after.

How the trial will work

1 · Today

Start free — ₹5 auth, auto-refunded

Sign up and authorise autopay (UPI or card) — payments secured by Razorpay. Your bank shows a one-time ₹5 authorisation that Razorpay refunds automatically. That's the whole setup — your founding seat is claimed the moment the mandate is authorised.

2 · Days 1–7

Learn to read flow, not candles

Use the week to watch how order-flow trading actually works — who's paying, who's absorbing, where positions are building — live, on NIFTY, SENSEX and 208 stocks. It's the oldest discipline in the market, the one desks never abandoned; candles just made everyone else forget it. Seven days covers every kind of session, including a NIFTY Tuesday and a SENSEX Thursday expiry, when the tape speaks loudest. Learn the read before you ever risk a rupee on it.

3 · Day 8

You decide

We remind you a day before billing. Do nothing and your plan continues at your locked founding rate; cancel and nothing is ever charged.

7-day full-access trial Cancel anytime Pro-rata refunds Prices include GST Data, not advice

Pricing questions, answered straight

What exactly does "locked for life" mean?
Your founding price never increases for as long as your subscription stays continuously active — through every feature we ship. If you cancel and later return, you rejoin at the list price current at that time, and your founding seat is released to the pool.
Why an autopay mandate before the trial?
It keeps the trial genuinely friction-free at day 8 — no chasing payment links mid-week. RBI rules protect you throughout: you authorise the exact amount upfront, you're notified before every charge, and cancelling the mandate takes two taps in your UPI app or with us.
What happens if I cancel mid-period?
You keep access until the period you paid for ends — and refunds follow our published pro-rata policy. It's in our refund policy, not just on this page.
Will TBTflow tell me what to buy or sell?
No — and it never will. TBTflow is a data & analytics product for education and information. It shows you what the market is doing; every decision is yours.

Prices in INR, inclusive of GST. Founding-member pricing is limited to a fixed founding cohort (cohort size as defined in our Terms of Service) and requires continuous subscription to retain. Auto-renewal will be processed via RBI-compliant e-mandate (UPI Autopay / card) with advance pre-debit notification; cancel anytime before a billing date to avoid the next charge. TBTflow is a data & analytics platform for educational and informational purposes only; it does not provide investment advice and is not a SEBI-registered investment adviser or research analyst.

FAQ

Order flow, in plain English.

The questions traders actually search — answered the way we'd explain them at the desk.

What is order flow trading?
Order flow trading means reading the market through actual executed trades and order-book changes — who is hitting bids, who is lifting asks, and how much size is behind each — instead of waiting for a candle to close. TBTflow displays this as live pressure data for NSE F&O.
What is a market mood index?
A market mood index summarises overall sentiment in one reading. Most update once a day from broad inputs. TBTflow's MarketMood is computed tick-by-tick from live order flow, futures and options data — so the mood you see is the mood of the current move, not yesterday's.
How do option chain OI walls act as support and resistance?
When option writers concentrate large open interest at a strike, that strike often behaves like a wall — price approaching it meets hedging flow and positioning pressure. TBTflow maps these walls from the live option chain and tracks when they build, hold or migrate.
What do futures premium and discount mean?
Basis is the gap between the futures price and fair value. A persistent excess premium or discount reflects how leveraged participants are positioned. TBTflow normalises basis for days-to-expiry and shows its intraday drift alongside price.
What is absorption in trading?
Absorption is when aggressive selling (or buying) keeps hitting the book but price refuses to give way — passive size is soaking it up. It's one of the clearest order-flow tells, and TBTflow's radar flags it as it happens.
Does TBTflow tell me what to buy or sell?
No — and it never will. TBTflow is a data & analytics product for education and information. It describes market activity; it does not give investment advice, recommendations or tips, and it is not a SEBI-registered advisory service. Every decision is yours.
Not ready to start?

Get the launch notes instead.

Prefer to watch before you trial? Leave your details and we'll send occasional launch notes — new panels, new guides, founding-seat status. No spam, no pressure.

No spam · we'll only email about your access. Analytics & education — not investment advice.