Tape reading, 13 October 2026: today's top 5 gainers and losers
Of today's 10 biggest movers, the stock went the first read's way from that minute to the close on 5, the other way on 4, stayed flat on 1, and 0 had no read. The list is the market's — the 5 biggest gainers and the 5 biggest losers of 214 F&O stocks by official close. For each one: the first minute any panel showed a read, the price then, and the move from that minute to the close. Every row states how much of the day was the opening gap — a flag at 09:31 cannot show a gap that happened at 09:15.
| Stock | Day | = gap | + traded | First read | At | To close | Agreed? |
|---|---|---|---|---|---|---|---|
| BANDHANBNK | +9.2 % | +2.9 % | +6.3 % | pressure ▲ 09:16 | 167.25 | +2.8 % | ✓ read's way |
| Buy · At High | |||||||
| HCLTECH | +8.4 % | +1.8 % | +6.6 % | large print ▲ 09:16 | 1,261.90 | +5.1 % | ✓ read's way |
| ₹5.8 cr | |||||||
| KPITTECH | +6.8 % | +1.0 % | +5.8 % | breakout ▲ 09:17 | 489.70 | +4.9 % | ✓ read's way |
| TCS | +6.8 % | +1.5 % | +5.3 % | pressure ▲ 09:22 | 2,193.80 | +3.4 % | ✓ read's way |
| Buy · At High | |||||||
| SHRIRAMFIN | +6.3 % | −0.0 % | +6.3 % | pressure ▼ 09:17 | 929.50 | +6.3 % | ✗ other way |
| Sell · Into Strength | |||||||
| Stock | Day | = gap | + traded | First read | At | To close | Agreed? |
|---|---|---|---|---|---|---|---|
| RBLBANK | −7.1 % | −4.2 % | −2.9 % | large print ▼ 09:16 | 388.35 | −0.1 % | · flat |
| ₹3.2 cr | |||||||
| ICICIPRULI | −3.5 % | −0.3 % | −3.2 % | pressure ▲ 09:18 | 461.95 | −3.2 % | ✗ other way |
| Buy · At High | |||||||
| POWERINDIA | −3.3 % | −2.5 % | −0.8 % | breakdown ▼ 09:17 | 29,940.00 | +1.0 % | ✗ other way |
| VEDL | −3.2 % | −0.7 % | −2.6 % | pressure ▲ 09:30 | 259.10 | −1.1 % | ✗ other way |
| Buy · Into Weakness | |||||||
| MCX | −2.4 % | −0.3 % | −2.1 % | breakdown ▼ 09:21 | 3,345.60 | −1.1 % | ✓ read's way |
The retro read, stock by stock
Each chart is the cash price through the session with every panel read on it: ▲▼ level breaks, ◆ Pressure Zones, ● large prints (blue = upward read, amber = downward). The dotted line is the first read; the dashed line is the previous close.
BANDHANBNK · +9.2 %
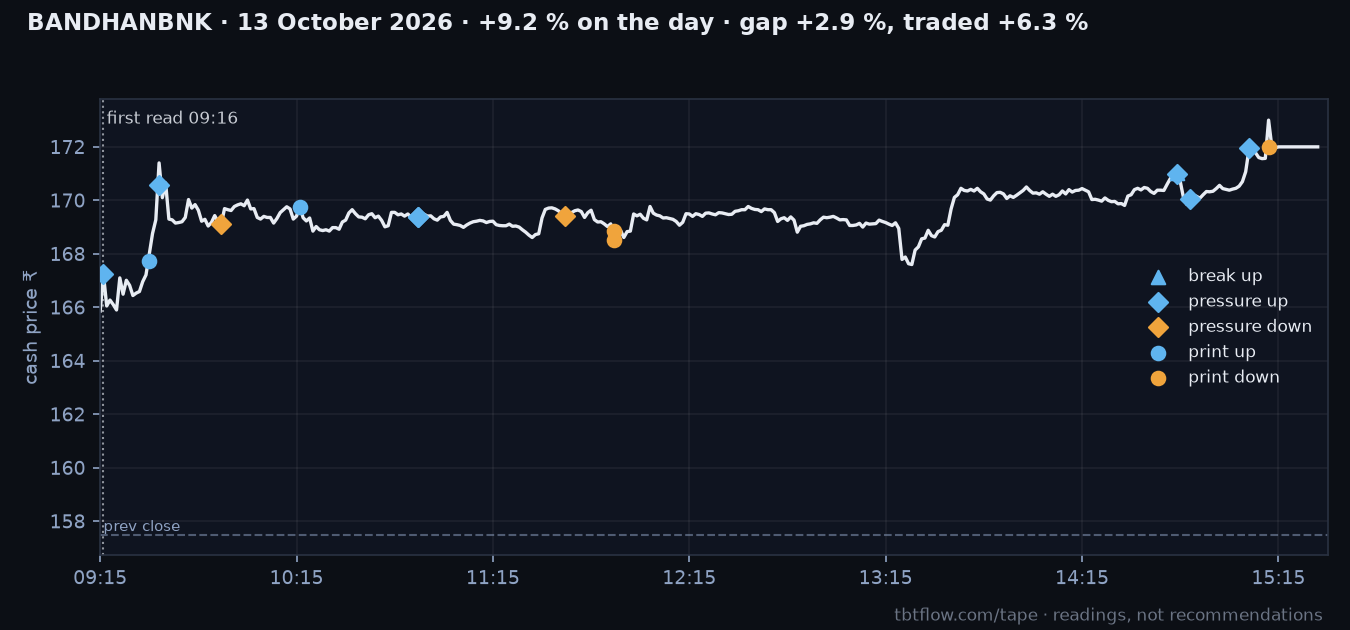
BANDHANBNK closed +9.2 %: +2.9 % at the open, +6.3 % traded. First read: pressure, upward, 09:16 at 167.25; from there to the close: +2.8 %. Went the read's way.
Cash tape: buyers led — net +₹55 cr on ₹859 cr traded; first hour +₹52 cr, last hour +₹8 cr.
Futures: buyers were the aggressor — net +₹1 cr on ₹131 cr; open interest −1.0 % from the open.
Level breaks flagged: 1 upward, 0 downward.
Pressure Zones: 09:16 ▲ Buy · At High → 09:33 ▲ Buy · Cash only → 09:52 ▼ Sell · Into Strength → 10:52 ▲ Retail Buy / Smart Sell → 10:52 ▲ Buy · Cash only (+4 more).
Large prints: 6 — ₹6 cr on the buy side, ₹11 cr on the sell side.
HCLTECH · +8.4 %
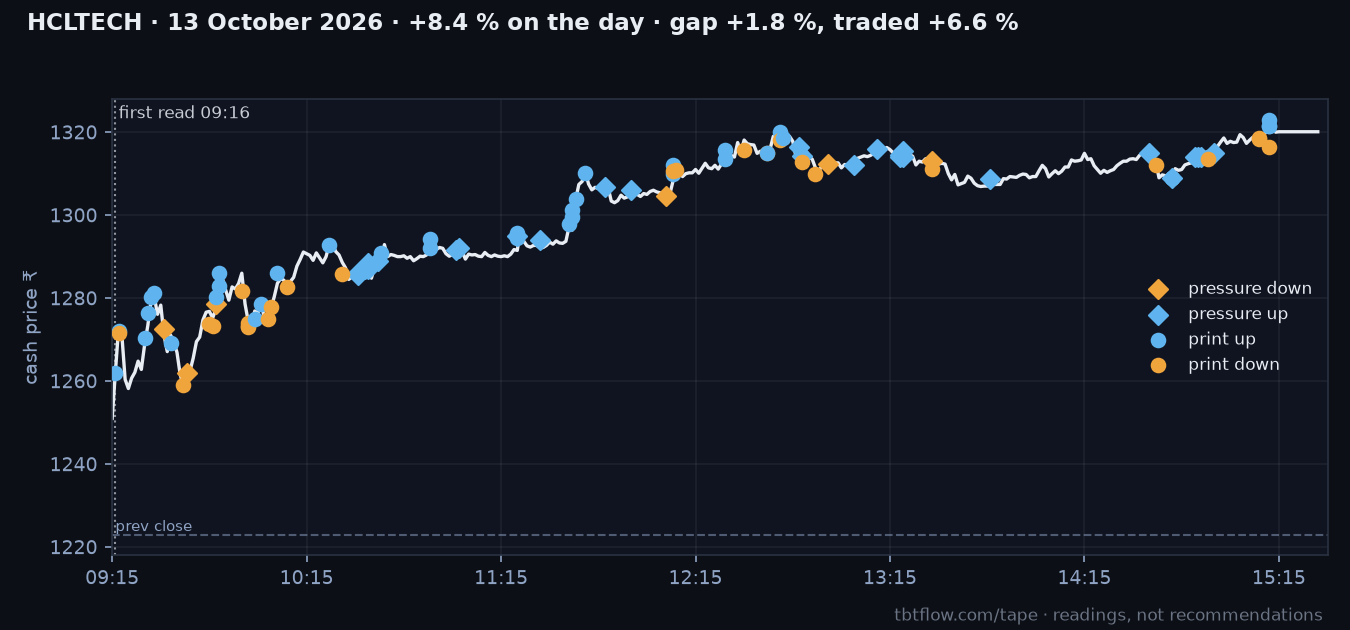
HCLTECH closed +8.4 %: +1.8 % at the open, +6.6 % traded. First read: large print, upward, 09:16 at 1,261.90; from there to the close: +5.1 %. Went the read's way.
Cash tape: buyers led — net +₹26 cr on ₹2,750 cr traded; first hour +₹12 cr, last hour −₹5 cr.
Futures: sellers were the aggressor — net −₹5 cr on ₹1,738 cr; open interest −0.3 % from the open.
Pressure Zones: 09:31 ▼ Sell · Into Strength → 09:38 ▼ Sell · Counter-Trend → 09:47 ▼ Sell · Into Strength → 10:31 ▲ Retail Buy / Smart Sell → 10:31 ▲ Buy · Cash only (+29 more).
Large prints: 69 — ₹181 cr on the buy side, ₹107 cr on the sell side.
KPITTECH · +6.8 %
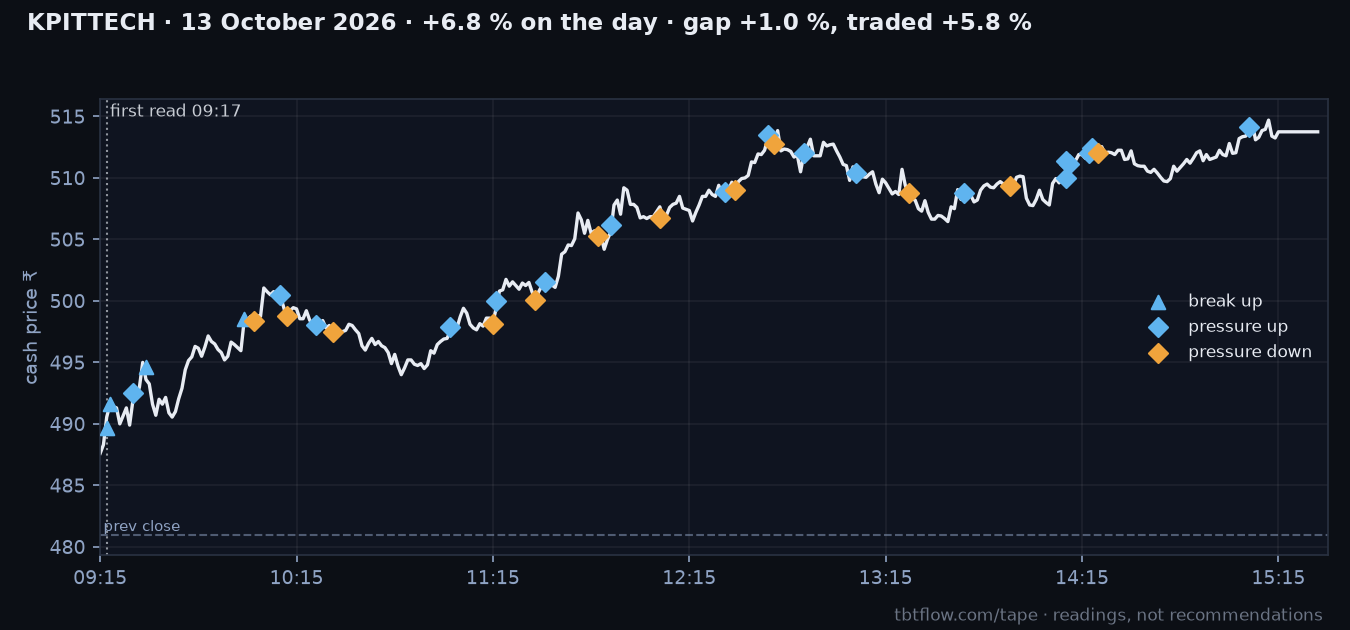
KPITTECH closed +6.8 %: +1.0 % at the open, +5.8 % traded. First read: breakout, upward, 09:17 at 489.70; from there to the close: +4.9 %. Went the read's way.
Cash tape: buyers led — net +₹28 cr on ₹307 cr traded; first hour +₹4 cr, last hour +₹9 cr.
Futures: buyers were the aggressor — net +₹14 cr on ₹144 cr; open interest −1.2 % from the open.
Level breaks flagged: 4 upward, 0 downward.
Pressure Zones: 09:25 ▲ Buy · At High → 10:02 ▼ Sell · Into Strength → 10:10 ▲ Buy · At High → 10:12 ▼ Sell · Into Strength → 10:21 ▲ Buy · Cash only (+25 more).
TCS · +6.8 %
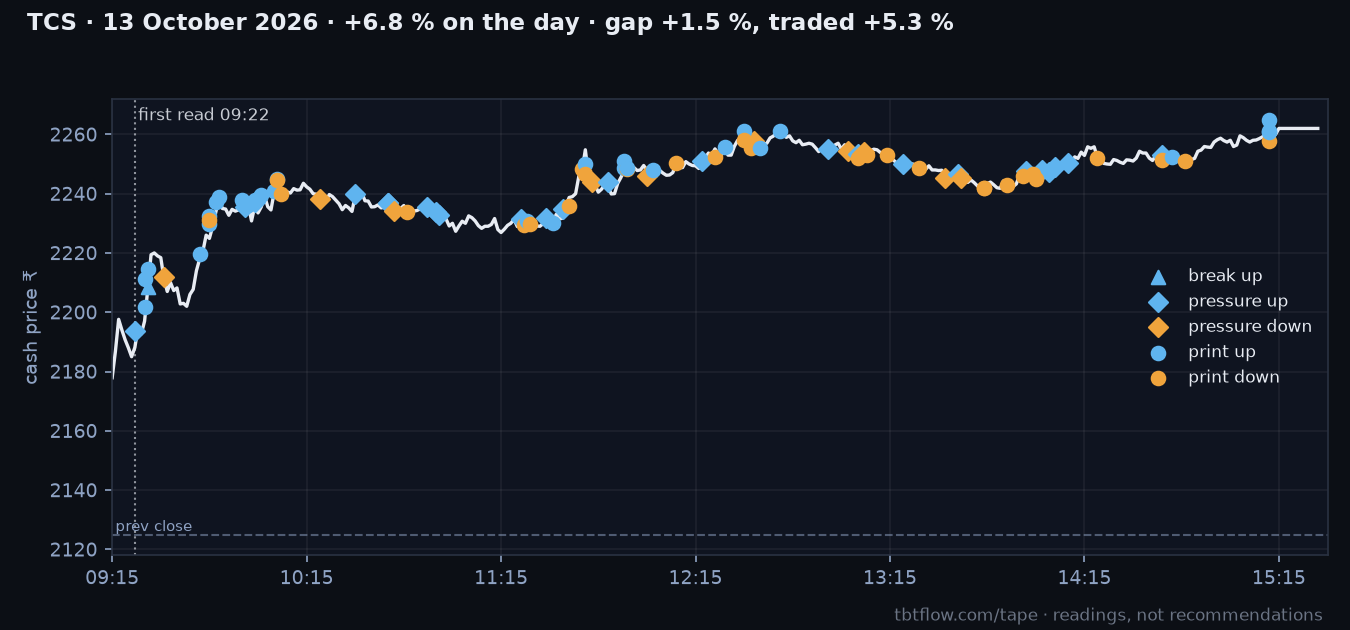
TCS closed +6.8 %: +1.5 % at the open, +5.3 % traded. First read: pressure, upward, 09:22 at 2,193.80; from there to the close: +3.4 %. Went the read's way.
Cash tape: buyers led — net +₹11 cr on ₹2,353 cr traded; first hour +₹82 cr, last hour +₹4 cr.
Futures: buyers were the aggressor — net +₹250 cr on ₹1,869 cr; open interest +3.3 % from the open.
Level breaks flagged: 1 upward, 0 downward.
Pressure Zones: 09:22 ▲ Buy · At High → 09:31 ▼ Sell · Into Strength → 09:56 ▲ Buy · Cash + Fut aligned → 09:59 ▲ Buy · At High → 10:19 ▼ Sell · Into Strength (+29 more).
Large prints: 59 — ₹160 cr on the buy side, ₹155 cr on the sell side.
SHRIRAMFIN · +6.3 %
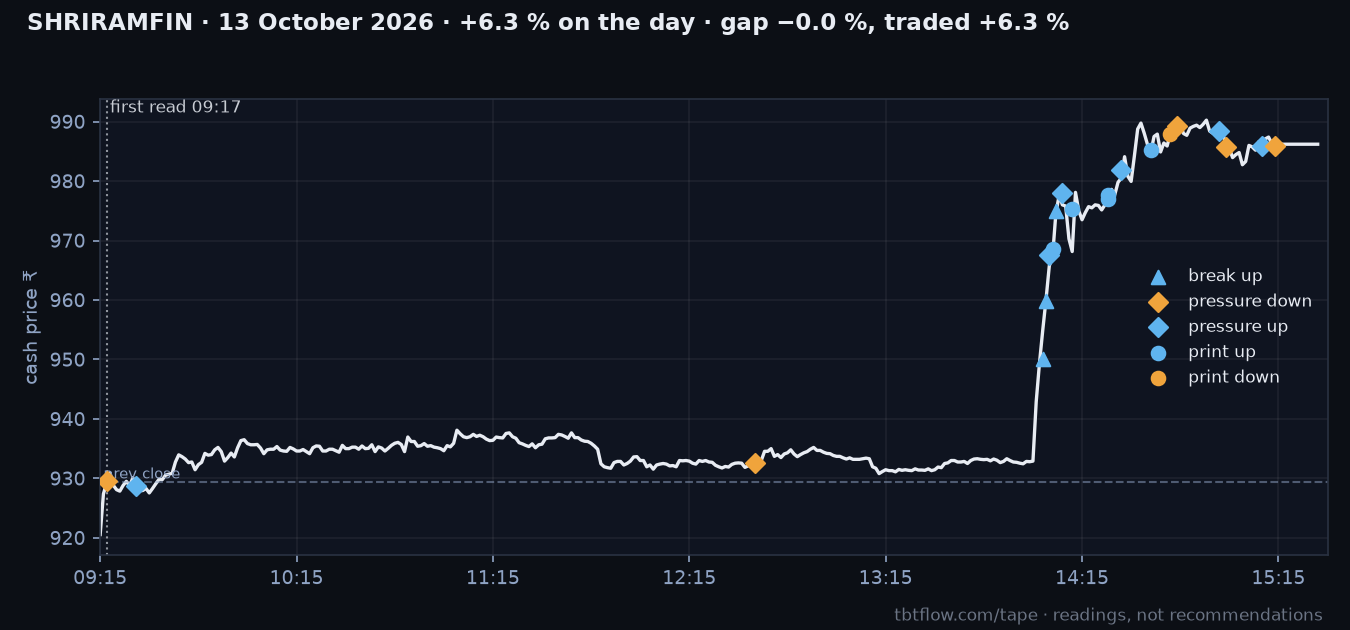
SHRIRAMFIN closed +6.3 %: −0.0 % at the open, +6.3 % traded. First read: pressure, downward, 09:17 at 929.50; from there to the close: +6.3 %. Went the other way.
Cash tape: buyers led — net +₹75 cr on ₹764 cr traded; first hour +₹8 cr, last hour +₹32 cr.
Futures: buyers were the aggressor — net +₹150 cr on ₹1,060 cr; open interest +9.9 % from the open.
Level breaks flagged: 3 upward, 0 downward.
Pressure Zones: 09:17 ▼ Sell · Into Strength → 09:26 ▲ Buy · At High → 12:35 ▼ Sell · Into Strength → 14:05 ▲ Buy · At High → 14:09 ▲ Buy · Cash only (+6 more).
Large prints: 7 — ₹21 cr on the buy side, ₹3 cr on the sell side.
RBLBANK · −7.1 %
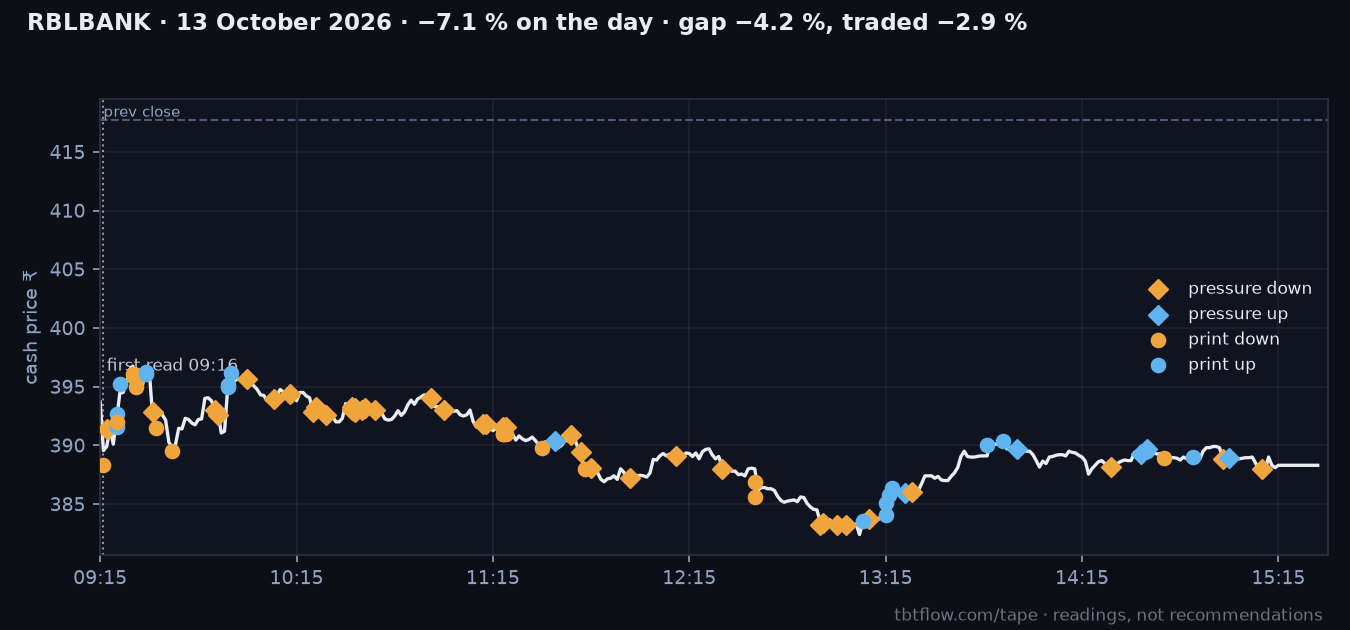
RBLBANK closed −7.1 %: −4.2 % at the open, −2.9 % traded. First read: large print, downward, 09:16 at 388.35; from there to the close: −0.1 %. Flat after the read.
Cash tape: buyers led — net +₹32 cr on ₹1,491 cr traded; first hour +₹14 cr, last hour +₹42 cr.
Futures: buyers were the aggressor — net +₹34 cr on ₹2,235 cr; open interest +46.8 % from the open.
Pressure Zones: 09:17 ▼ Sell · Cash only → 09:26 ▼ Sell · Into Strength → 09:31 ▼ Sell · Cash only → 09:50 ▼ Sell · Into Strength → 09:51 ▼ Sell · Cash only (+43 more).
Large prints: 36 — ₹109 cr on the buy side, ₹91 cr on the sell side.
ICICIPRULI · −3.5 %
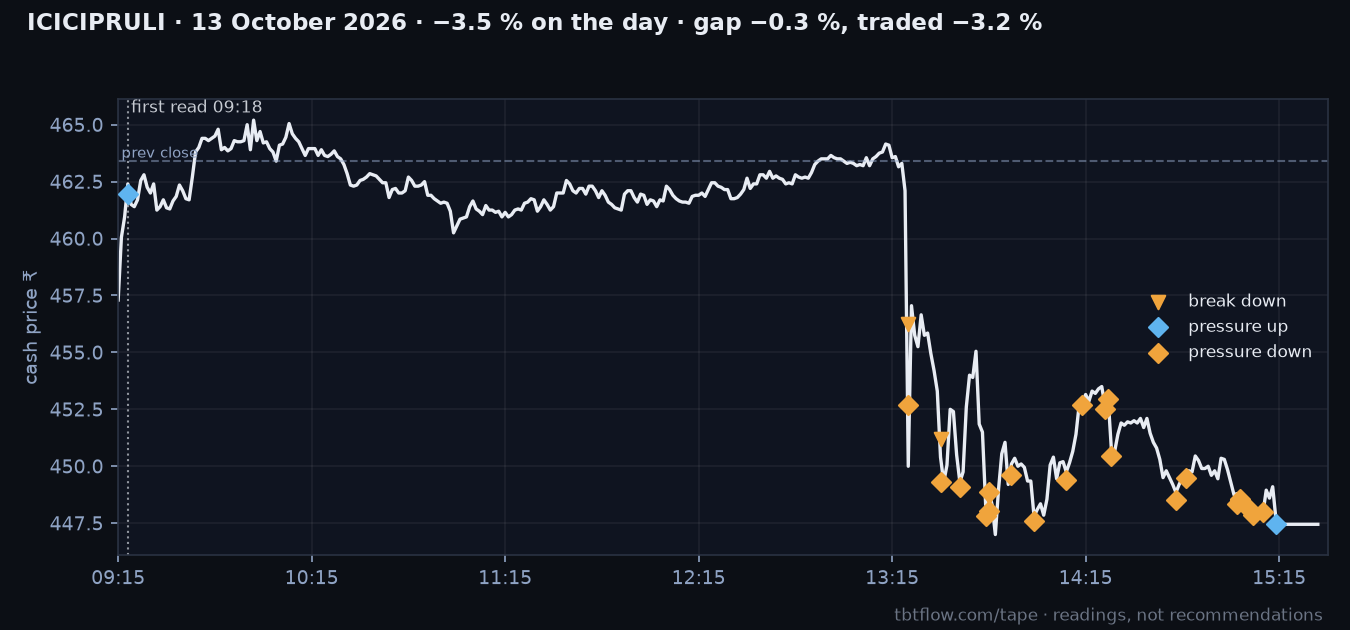
ICICIPRULI closed −3.5 %: −0.3 % at the open, −3.2 % traded. First read: pressure, upward, 09:18 at 461.95; from there to the close: −3.2 %. Went the other way.
Cash tape: sellers led — net −₹6 cr on ₹137 cr traded; first hour +₹1 cr, last hour −₹7 cr.
Futures: sellers were the aggressor — net −₹6 cr on ₹285 cr; open interest +8.6 % from the open.
Level breaks flagged: 0 upward, 3 downward.
Pressure Zones: 09:18 ▲ Buy · At High → 13:20 ▼ Sell · Cash only → 13:30 ▼ Sell · At Low → 13:36 ▼ Sell · Cash only → 13:44 ▼ Sell · At Low (+18 more).
POWERINDIA · −3.3 %
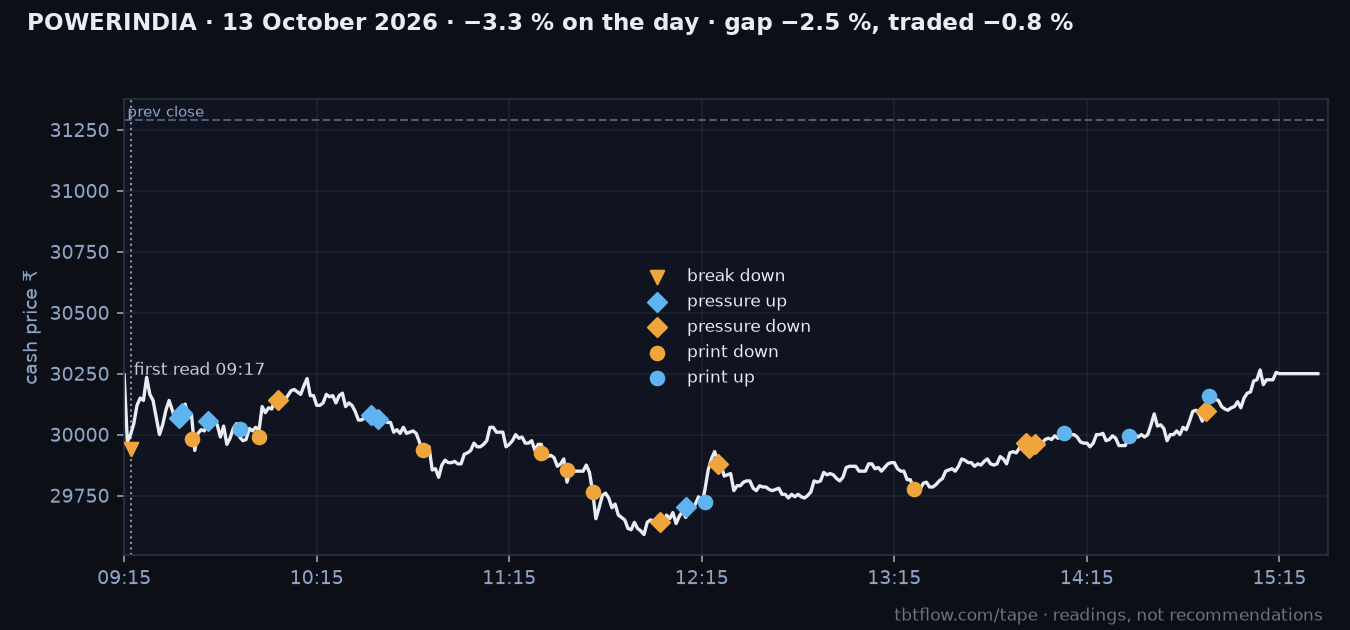
POWERINDIA closed −3.3 %: −2.5 % at the open, −0.8 % traded. First read: breakdown, downward, 09:17 at 29,940.00; from there to the close: +1.0 %. Went the other way.
Cash tape: sellers led — net −₹24 cr on ₹585 cr traded; first hour −₹20 cr, last hour +₹30 cr.
Futures: sellers were the aggressor — net −₹1 cr on ₹445 cr; open interest +6.8 % from the open.
Level breaks flagged: 0 upward, 1 downward.
Pressure Zones: 09:32 ▲ Buy · Into Weakness → 09:33 ▲ Buy · Counter-Trend → 09:41 ▲ Buy · Into Weakness → 10:03 ▼ Sell · Into Strength → 10:32 ▲ Buy · Counter-Trend (+8 more).
Large prints: 13 — ₹19 cr on the buy side, ₹36 cr on the sell side.
VEDL · −3.2 %
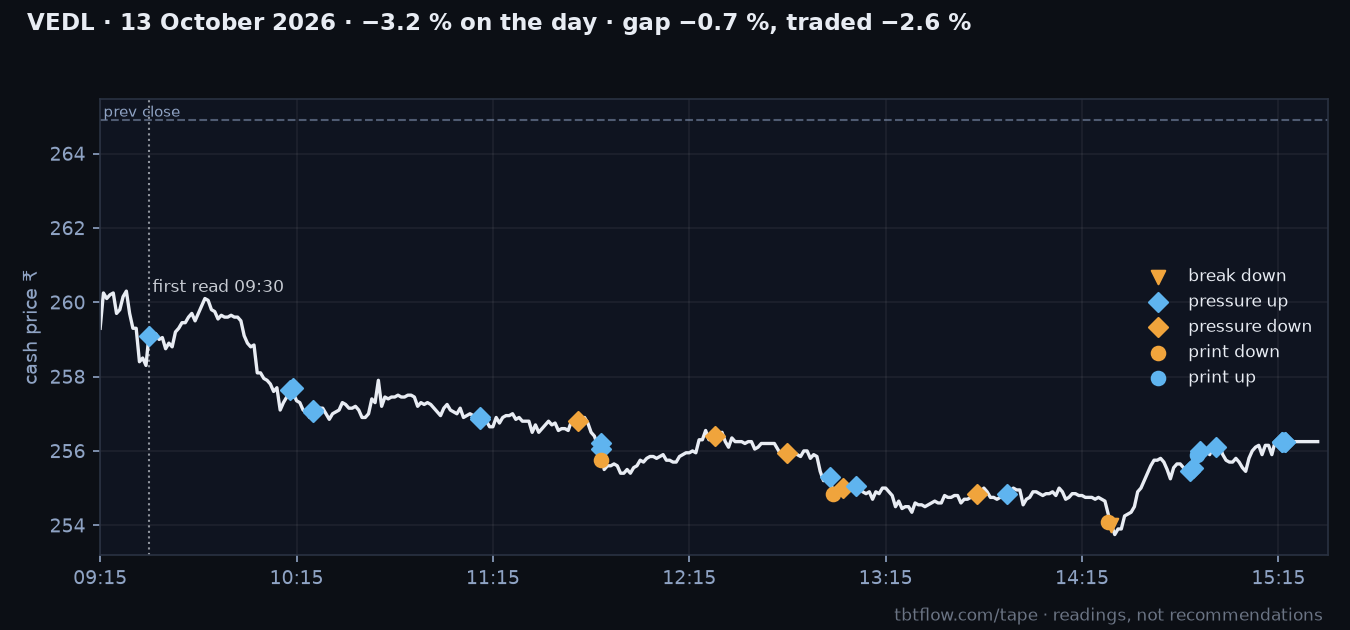
VEDL closed −3.2 %: −0.7 % at the open, −2.6 % traded. First read: pressure, upward, 09:30 at 259.10; from there to the close: −1.1 %. Went the other way.
Cash tape: sellers led — net −₹48 cr on ₹475 cr traded; first hour −₹24 cr, last hour +₹4 cr.
Futures: sellers were the aggressor — net −₹10 cr on ₹208 cr; open interest +3.1 % from the open.
Level breaks flagged: 0 upward, 1 downward.
Pressure Zones: 09:30 ▲ Buy · Into Weakness → 10:13 ▲ Retail Buy / Smart Sell → 10:14 ▲ Buy · Into Weakness → 10:20 ▲ Retail Buy / Smart Sell → 10:20 ▲ Buy · Into Weakness (+20 more).
Large prints: 5 — ₹4 cr on the buy side, ₹17 cr on the sell side.
MCX · −2.4 %
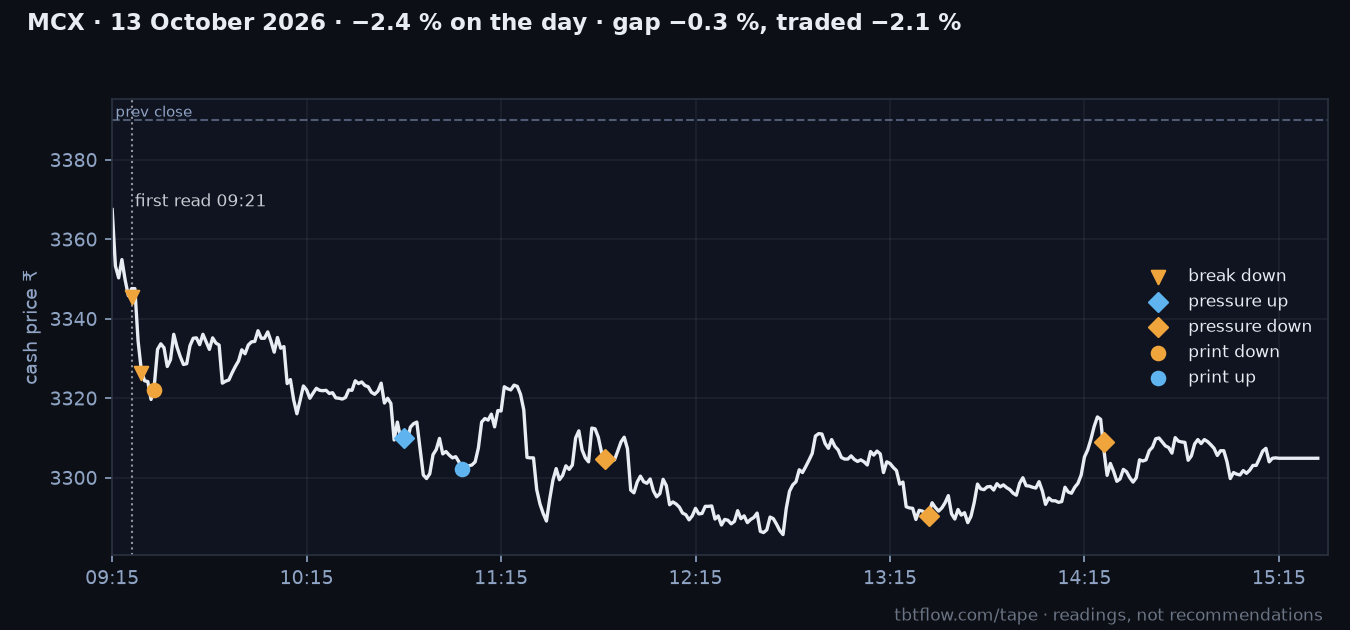
MCX closed −2.4 %: −0.3 % at the open, −2.1 % traded. First read: breakdown, downward, 09:21 at 3,345.60; from there to the close: −1.1 %. Went the read's way.
Cash tape: sellers led — net −₹23 cr on ₹537 cr traded; first hour −₹22 cr, last hour +₹14 cr.
Futures: sellers were the aggressor — net −₹28 cr on ₹440 cr; open interest +2.9 % from the open.
Level breaks flagged: 0 upward, 2 downward.
Pressure Zones: 10:45 ▲ Buy · Into Weakness → 11:47 ▼ Sell · Cash only → 13:27 ▼ Sell · At Low → 14:21 ▼ Sell · Cash only.
Large prints: 2 — ₹3 cr on the buy side, ₹3 cr on the sell side.
Panels read: Breakouts/Breakdowns (volume-gated level breaks), Pressure Zones, large prints on the cash tape from 09:16. "First read" is the earliest of those with a direction. "To close" is the move from the read's own minute, so a gap at the open is never counted for or against it. Prices are the official NSE open and close. Readings, not recommendations — this page shows the misses on purpose.
The same panels, live, on every NSE F&O stock — breakouts, pressure, large prints, the futures book.
This page is the after-photo. The dashboard is the window during the session.
Read every panel behind these numbers, chapter by chapter.
Trading by the Numbers walks through the quantitative reads behind a modern F&O dashboard — order-flow imbalance, footprints, VWAP bands, OI flow, gamma structure and the expiry endgame — in plain trader-to-trader language.